


Hotels

Flights
Murcia Monthly Climate Averages

Murcia is located in semi-arid climate zone that is known for hot weather with minor participation during summer time and substantial temperature changes during the day.
To help you choose the best time to travel, you can find climate data below on the weather in Murcia .
| Month | day |
night |
rain |
|
| January | +16.6 | +4.7 | 27 | 10.4h |
| February | +18.4 | +5.9 | 27 | 11.3h |
| March | +20.9 | +7.7 | 30 | 12.4h |
| April | +23.3 | +9.7 | 25 | 13.7h |
| May | +26.6 | +13.3 | 28 | 14.7h |
| June | +31 | +17.4 | 18 | 15.3h |
| July | +34 | +20.3 | 3 | 15h |
| August | +34.2 | +20.9 | 8 | 14h |
| September | +30.4 | +18 | 32 | 12.8h |
| October | +25.6 | +13.9 | 36 | 11.6h |
| November | +20.3 | +8.9 | 32 | 10.6h |
| December | +17.2 | +5.8 | 29 | 10.1h |
Best time with the soft weather for the sightseeing and long walks in Murcia are February, March, April, May, October, November.
Temperature in Murcia
The table shows that the hottest months in Murcia are August and July, during which the average daytime temperature reaches +34.2°C and the nighttime temperature falls to +20.9°C.
The coldest months are January and December, when the daily average temperature falls to +16.6°C, and drops to +4.7°C during the night.
Best beach resorts :

Dubai
UAE

Venice
Italy

Cape Town
South Africa
Phuket
Thailand

Bangkok
Thailand
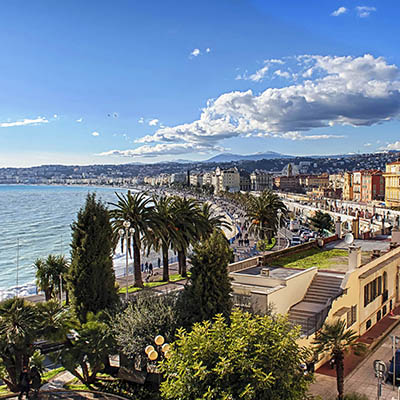
Nice
France


Most Popular Destinations in the World
Precipitation
The largest amount of precipitation falls on average in October and September, up to 36mm, and the least in July and August — up to 3mm.