

Chile Monthly Climate Averages
To help you choose the best time to travel, you can find climate data below on the weather in Chile .
| Month | Vina del Mar | Santiago | ||
| day | night | day | night | |
| January | +20.8°C | +13.5°C | +29.4°C | +11.8°C |
| February | +20.7°C | +13.5°C | +28.9°C | +11.1°C |
| March | +19.4°C | +12.7°C | +26.9°C | +9.4°C |
| April | +17.9°C | +11.4°C | +22.8°C | +6.9°C |
| May | +16.5°C | +10.8°C | +18.2°C | +4.9°C |
| June | +15.2°C | +9.6°C | +14.8°C | +3.3°C |
| July | +14.3°C | +9.2°C | +14.3°C | +2.5°C |
| August | +14.8°C | +9.3°C | +16.2°C | +3.4°C |
| September | +15.4°C | +9.5°C | +18.4°C | +5.2°C |
| October | +16.5°C | +10.4°C | +22°C | +7.2°C |
| November | +18.2°C | +11.5°C | +15.3°C | +9°C |
| December | +19.9°C | +12.8°C | +28.1°C | +10.9°C |
Temperature in Chile
The table shows that the hottest months in Chile are January and February, during which the average daytime temperature reaches 29.4°C and the nighttime temperature falls to 13.5°C.
The coldest months are July and August, when the daily average temperature falls to 14.3°C, and drops to + 2.5°C during the night.
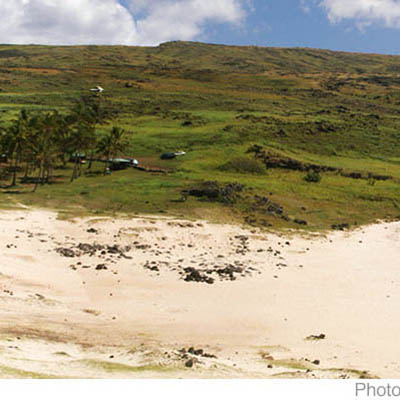
Best places in Chile:

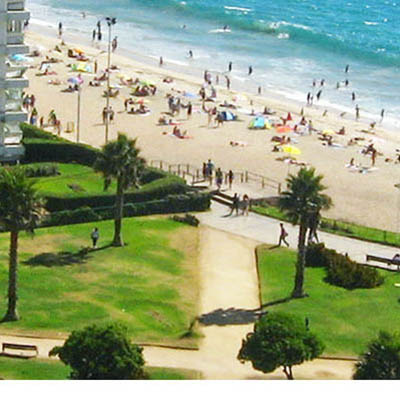


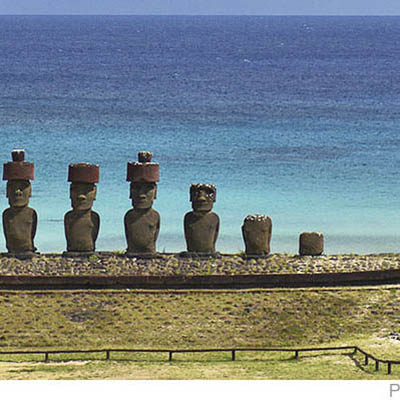
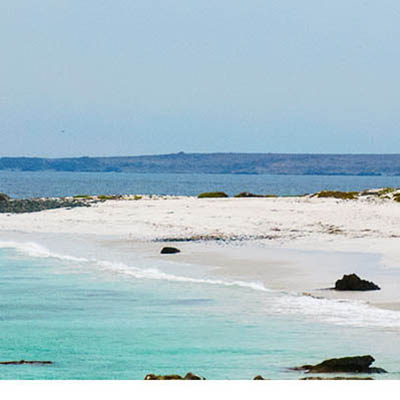
+ More


Most Popular Destinations in the World
Sea temperature
The highest average monthly temperature in the Pacific Ocean on the beaches of Vina del Mar is in February and January and is 17-18°C.
Precipitation
The largest amount of rain falls on average in July and June, up to 111mm, and the least in January and February.