

Beach resorts in Egypt Monthly Climate Averages
To help you choose the best time to travel, you can find climate data below on the weather on the beach resorts in Egypt .
| Month | Sharm el Sheikh | Hurghada | ||
| day | night | day | night | |
| January | +21.7°C | +13.3°C | +21.8°C | +11.7°C |
| February | +22.4°C | +13.7°C | +22.7°C | +12.2°C |
| March | +25.1°C | +16.1°C | +25.4°C | +14.8°C |
| April | +29.8°C | +20.1°C | +29.2°C | +18.4°C |
| May | +33.9°C | +23.8°C | +32.9°C | +22.6°C |
| June | +37°C | +26.5°C | +35.5°C | +25.8°C |
| July | +37.5°C | +26.7°C | +36.7°C | +27.5°C |
| August | +37.5°C | +28°C | +36.8°C | +27.6°C |
| September | +35.4°C | +26.5°C | +34.6°C | +25.2°C |
| October | +31.5°C | +23.4°C | +31.6°C | +22°C |
| November | +27°C | +18.9°C | +27.4°C | +17.5°C |
| December | +23.2°C | +15°C | +23.4°C | +13.3°C |
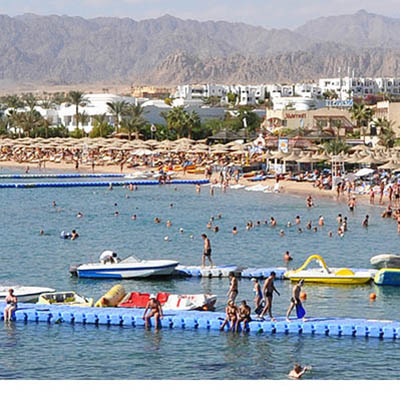
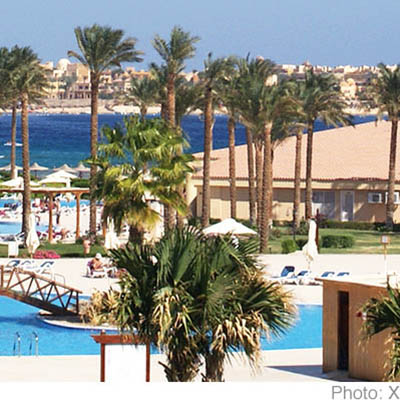
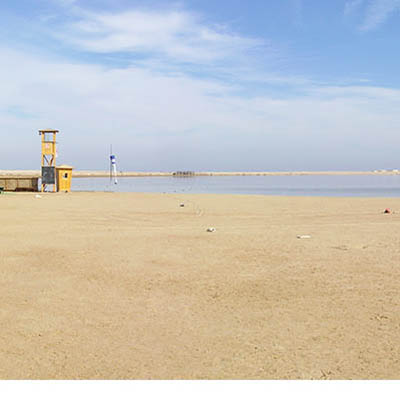
Best places on the beach resorts in Egypt
Temperature on the beach resorts in Egypt
The table shows that the hottest months on the beach resorts in Egypt are July and August, during which the average daytime temperature reaches 37.5°C and the nighttime temperature falls to 27.5°C.
The coldest months are January and February, when the daily average temperature falls to 21.7°C, and drops to + 11.7°C during the night.
Most booked hotels on the beach resorts in Egypt
Search flights to Beach resorts in Egypt
Best places on the beach resorts in Egypt:


Most Popular Destinations in the World
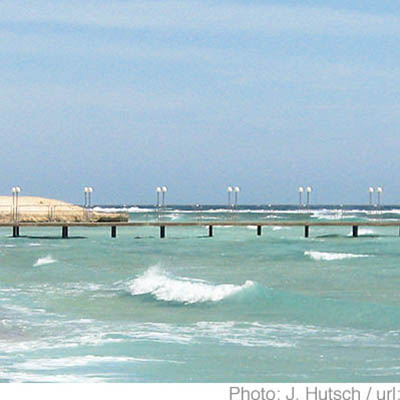
Sea temperature
The highest average monthly temperature in the Red Sea on the beaches of Sharm el Sheikh is in September and August and is 27°C.
The highest average monthly temperature in the Red Sea on the beaches of Hurghada is in September and August and equals 27°C.
on the beach resorts in Egypt climate by month
Precipitation
The largest amount of rain falls on average in November and January, up to 3mm, and the least in February and April.