


Hotels

Flights
Caribbean coast Monthly Climate Averages

To help you choose the best time to travel, you can find climate data below on the weather on the Caribbean coast .
| Month | Cancun | Bocas del Toro | ||
| day | night | day | night | |
| January | +28.3°C | +19.8°C | +34.6°C | +17.6°C |
| February | +29.4°C | +20.3°C | +34.2°C | +18°C |
| March | +30.7°C | +21°C | +32.8°C | +17.6°C |
| April | +32.2°C | +22.6°C | +34.4°C | +17.4°C |
| May | +33.5°C | +23.9°C | +36°C | +17.6°C |
| June | +33.7°C | +24.7°C | +33.2°C | +17.6°C |
| July | +34.3°C | +24.8°C | +33.4°C | +17°C |
| August | +34.8°C | +24.6°C | +36.2°C | +15°C |
| September | +33.7°C | +24.3°C | +37°C | +17.6°C |
| October | +31.6°C | +23.3°C | +34.4°C | +18°C |
| November | +29.8°C | +21.9°C | +33°C | +19.6°C |
| December | +28.6°C | +20.5°C | +33.6°C | +17°C |
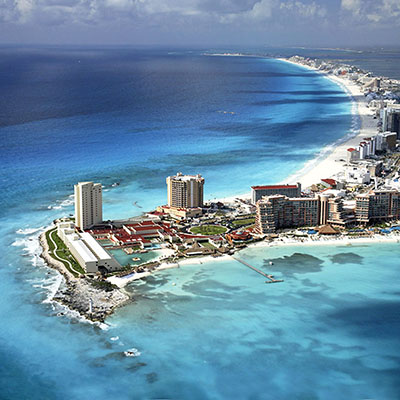
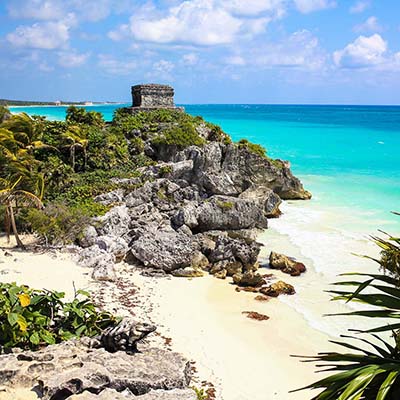
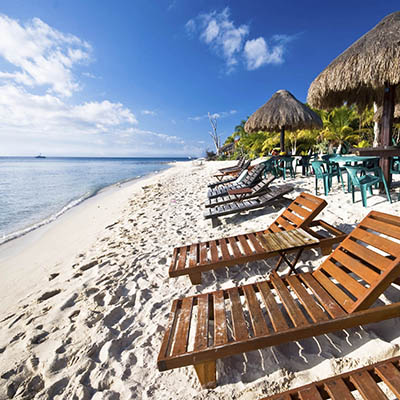
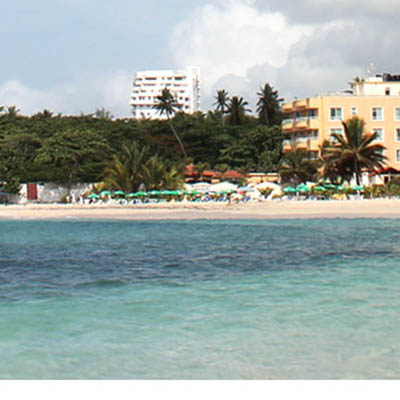
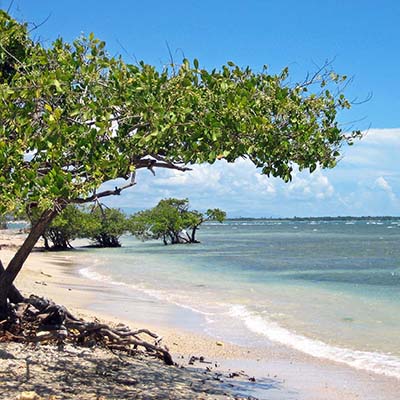
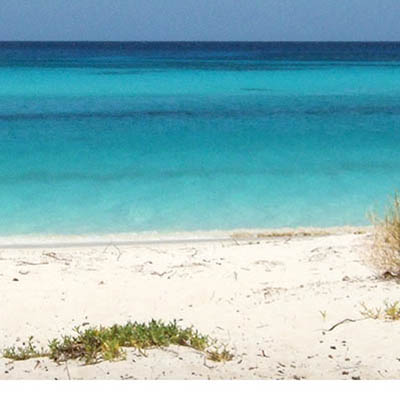
Best places on the Caribbean coast
Temperature on the Caribbean coast
The table shows that the hottest months on the Caribbean coast are August and July, during which the average daytime temperature reaches 36.2°C and the nighttime temperature falls to 24.6°C.
The coldest months are January and December, when the daily average temperature falls to 28.3°C, and drops to + 17.6°C during the night.
Most booked hotels on the Caribbean coast
Search flights to Caribbean coast
Best places on the Caribbean coast:


Most Popular Destinations in the World
Sea temperature
The highest average monthly temperature in the Caribbean Sea on the beaches of Cancun is in July and June and is 29°C.
The highest average monthly temperature in the Caribbean Sea on the beaches of Bocas del Toro is in September and June and equals 29.2°C.
on the Caribbean coast climate by month
Precipitation
The largest amount of rain falls on average in October and September, up to 272mm, and the least in April and March — up to 280mm.